
by dbward | Dec 16, 2019 | Tools 101
The Rose, Bud, Thorn tool is consistently the most downloaded tool in the kit. I have to admit that particular statistic from our website’s analytics always puzzled me a bit. I mean, RBT is a fine little method but it never struck me as particularly special. In fact, I always thought it looked pretty basic (that’s the term the kids use these days, right?). All you’re doing is listing the positive (rose), potential (bud), and negative (thorn) aspects of a project. No big deal, right?
Apparently my meh opinion was based on the fact that I’d never really used it before. When I finally did give it a try with a workshop last week, it pretty much blew me away.
What’s so awesome about this tool? Why do I love it now? Well, it is hugely accessible, for starters. There are no complicated steps to explain, no detailed procedures to follow, no subtle nuances to watch for. You’d think a guy who literally wrote the book on simplicity would be better at recognizing elegant simplicity when he sees it, but that’s the thing about simplicity. It often appears underwhelming at first blush. Sometimes the real value only becomes apparent when we look closer or take the thing out for a spin. I should probably go re-read my own book.
Last week’s workshop helped me see the RBT is a powerful lens groups can use to assess, analyze, and strategize. It reveals hidden assumptions and enables us to see past superficial considerations and achieve a deeper understanding of our situation. This participants spent an hour going through the RBT analysis, and it really set the stage for the rest of the two-day event.
If you’re going to use this with your team (and I highly recommend it!), I have one facilitation tip to consider: resist the urge to write the same thing in all three columns. This was a very common error in all the groups I worked with last week. Over and over again people said “We think X belongs in all three columns, because it has positive (rose), negative (thorn) and potential (bud) aspects.” Yes, the thing they’re talking about has roses, buds, and thorns. But the whole point of the tool is to distinguish between the roses, buds, and thorns. So putting the same word in all three columns isn’t terribly helpful. Once the groups began writing down the actual good, bad, and promising aspects of those things… the results were amazing.
How about an example? Consider a medical treatment that cures an illness. The cure is the ROSE. However, the treatment also has negative side effects. That’s the THORN. And let’s say that some (but not all) patients experience a secondary benefit. That would be the BUD.
Writing TREATMENT X in all three columns is not very helpful or insightful. It’s the wrong way to use the tool. Instead, I would suggest writing “Cures the disease” in the rose column. Then list the negative side effect (e.g. Causes significant fatigue) in the thorn column. Finally, describe the potential benefit (e.g. “Clears up acne for some patients”) in the bud column. We could now evaluate the relative costs and benefits of the treatment and decide how to proceed.
I hope you’ll give this tool a try – and we’d love to hear your stories of how you used it!
by dbward | Sep 23, 2019 | Tools 101
As part of our ongoing commitment to experimenting and communicating, we recently put together this little “video tour” of the Innovation Toolkit.
In a mere 9 minutes, we present detailed introductions to the six tools listed below (with handy links to the starting points in the video for each one)
- Problem Framing (2:15): Build clarity and consensus about the problem they are trying to solve
- Rose, Bud, Thorn (3:11): Assess the Positive, Negative, and Potential aspects of a project or topic
- Journey Map (4:14): Understand the user’s process, pain-points, and challenges
- PreMortem (5:15): Explore the future and establish a shared understanding of what success looks like
- Lotus Blossom (6:12): A structured ideation method for rapidly creating an organized set of creative ideas
- Trimming (7:25): A simplifying tool to experimentally reduce complexity or streamline a project, product, process, or plan
We hope you enjoy the video and share it with your friends!

by dbward | Aug 5, 2019 | Success Stories, Tools 101
Last year I had the opportunity to serve on a National Academy of Sciences committee. We were chartered to help NASA improve its innovation ecosystem, a truly awesome experience. One of my main contributions was to lead several Premortem sessions, where participants imagined a future scenario where NASA has failed completely. As always, the Premortem produced several moments of insight & honesty. It continues to be my favorite tool in the kit.
If you’re not familiar with Premortems, the objective is to build clarity and consensus about what success looks like. Although a lot of the discussion is focused on describing a hypothetical failure (making the description as stark and dystopian terms as possible), the key question in the Premortem canvas is actually “If the only thing we do is ______, that’s a win.” We don’t start with that question, but I always make sure we get to it before the Premortem is complete.
Here’s a short excerpt from the National Academy committee’s report, describing the consensus these groups came to during the Premortems:
…one of the answers that popped up in all three sessions was “to build strong collaborative partnerships with industry and internationally.”
In particular, a number of session participants acknowledged that NASA is no longer the only game in town and argued that the agency’s continued presence as a relevant leader in space and aerospace will thus depend on its role as a collaborative partner rather than an independent actor. One example that a number of participants mentioned is the existence of civilian space companies such as SpaceX that are increasingly accomplishing missions that were previously done by NASA alone. As long as NASA is recognized as a valuable partner in these missions… then the agency will rightfully receive some of the credit for successes in this area.
…three main things that participants identified as being important for avoiding a dystopian future: developing strong partnerships with industry
and internationally, continuing the learning culture at NASA and building on it, and improving communication across NASA and with those outside of the agency. NASA is already doing many of these things, the session participants said, but there is room for significant improvement in each area.
If you’d like to learn more about how NASA used the Premortem and how they answered the “If the only thing we do…” question, or even if you just want to see what NASA’s senior leaders are doing to help the agency improve, check out the full National Academy committee’s report, now available as a free PDF (see the “Download Free PDF” link on the right of that page).
by dbward | Jul 1, 2019 | Tools 101 |
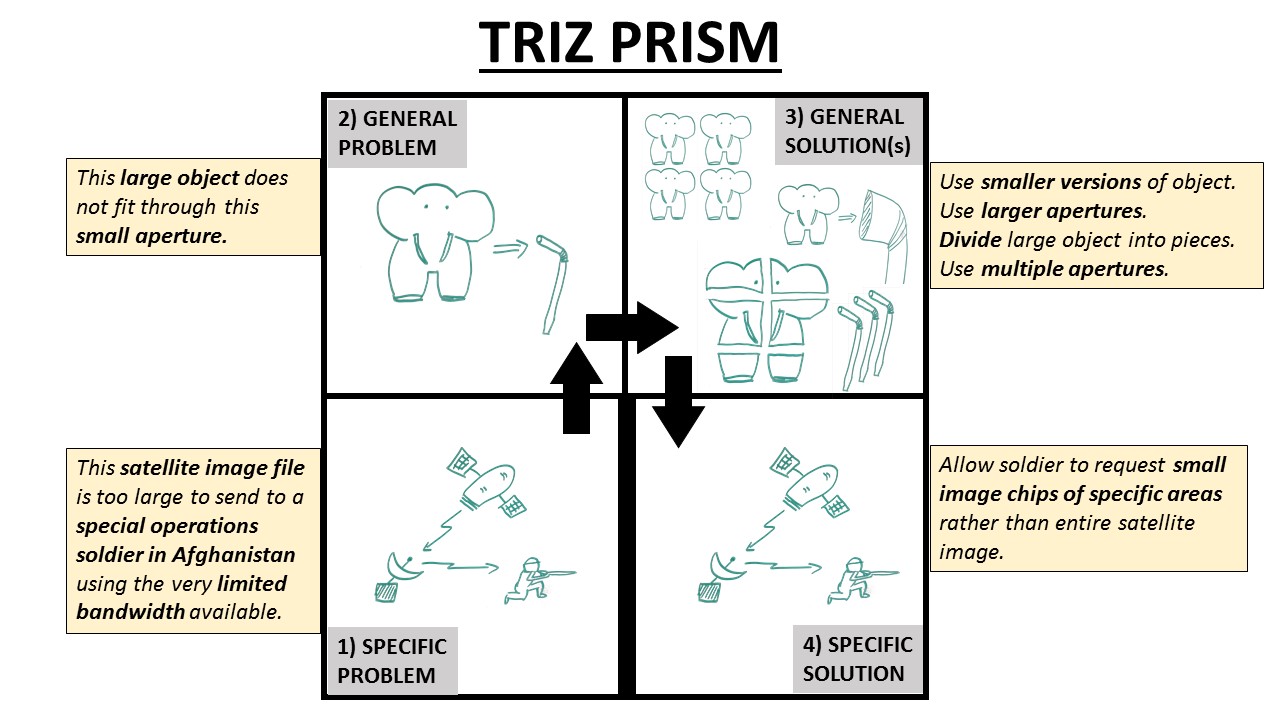
The TRIZ Prism tool is a powerful way to unlock a team’s creativity and discover new solutions to difficult problems. It’s a pretty straightforward practice to describe, but actually doing it can be a little trickier than it looks at first.
The Elephant-And-Straw example in the image below is based on a real-world project Dan worked on. The activity begins in the lower left corner (the box labeled 1 – Specific Problem), we wrote a very specific problem description… and realized it was a really hard problem, with no clear solution.
That’s where the TRIZ Prism comes in. We then stripped out all the particulars and developed a general problem statement. We came up with “the big thing does not fit through the small aperture,” then explored general solutions to that category of problem. Once we came up with some general “types-of-solutions-to-that-type-of-problem,” we reintroduced some specifics and came up with a specific solution. That may sound like an obvious way to generalize & summarize the problem, but getting there took significant effort.
How did we do it? In a word – incrementally. The process of moving from Box 1 to Box 2 went something like this:
- How can we get this satellite image through this bandwidth to this soldier on this timeline?
- How can we get anything through this bandwidth to this soldier on this timeline?
- How can we get anything through any medium to this soldier on this timeline?
- How can we get anything through any medium to anyone on this timeline?
- How can we bet anything through any medium to anyone on any timeline?
- How can we get anything to anyone?
With each version, we removed one level of specificity and replaced it with a generalized version. Alert readers may note that #6 does not say “How can we get a big thing through a small aperture?” That’s because #6 in the list above is actually not a very good generalized statement of our problem. We needed to massage it a bit and re-introduce some specifics to get something truly useful for our situation. I mention it to highlight the fact that any specific problem can be generalized in multiple ways… and some are better than others.
From “how can we get anything to anyone,” we put some of the specific constraints back into the problem statement and went with “How can we get a big thing through a small thing?” That statement has enough specificity to be useful, and is general enough to be open to a wide range of solutions.
We then explored a wide range of typical solutions to that category of problem, and came up with a specific solution that allowed the soldiers to draw a simple polygon on a map and request a small image chip. It worked great.
Interestingly, that solution meant our initial problem statement was actually a bit off base. They didn’t need the whole elephant in the first place. They just needed the trunk. And it turns out the trunk fit through the aperture nicely.
Disclaimer: No elephants were harmed in the production of this example.
by dbward | Jun 24, 2019 | Tools 101
SCENARIO: It’s Friday morning. You’re an analyst and just received an urgent request for an analysis due Monday. You are 99% sure a colleague has done this same analysis before, but you have no idea where it was stored. Your options are 1) spend all weekend searching for that old analysis and updating it, or 2) start from scratch and finish a new version by the end of today. Which option do you choose? Is it more efficient to reinvent the wheel? Or to spend the time looking for something which may not be found – or may not even exist?
It often feels like we are stuck choosing the lesser of two evils when faced with a decision like this. Option 1 is risky – what if you don’t end up finding what you need, and you wasted all that time searching? Option 2 can be frustrating – you are pretty sure someone else has done the work already, but you simply don’t have time to figure out how to leverage it.
Team Toolkit recently delivered a workshop to help a group of intelligence analyst to explore solutions to that scenario. We began with a tool called the “Problem Framing Canvas”, which aims to help build a consensus about a problem statement and make sure the team is solving the right problem to begin with. After some discussion, the group agreed that “analysis takes too long” was a pretty good description of the problem. It’s short, clear, and does not dictate a specific solution.
It can be tempting to skip the “defining the problem” phase and move right into “solving the problem,” but building a consensus about the problem is always a worthwhile exercise. The Problem Framing Canvas helped the group identify other groups who also experience this problem (spoiler: MANY other teams) and who has figured out how to solve this problem (not many have – it’s a hard problem!).
After framing the problem, we moved to a second tool, Journey Mapping. A Journey Map is a visual tool that focuses on a user’s experience. It identifies phases, steps, actions, opportunities, and pain points in the analysis process, starting with the request for a product and ending with delivering the product. The process of developing such a map is often just as valuable for the team as the product itself.
Because the participants were geographically dispersed across three different locations, we paused our Skype call to allow each location to sketch out the journey of a typical analyst on the whiteboard, including steps that are typically challenging to accomplish. We then regrouped to share ideas and consolidate everyone’s work into one giant journey map.
The Journey Map highlighted points within the process that contribute to the problem and make analysis take so long. It also helped the team identify opportunities to introduce new processes, practices, and technologies that could speed things up. Participants left the workshop with a visual map of their process and a consolidated list of requirements for a new platform solution they could build, to help analysis go faster.
Hat Tip to Andrea & Allison for co-authoring this story
by dbward | May 20, 2019 | Tools 101
Last week. Rachel’s blog post looked at the importance of asking Why. This week we’ll take a closer look at the Problem Framing Canvas she mentioned. It’s designed to be used with a team to establish a clear consensus about what problem you’re trying to solve.
When I’m leading one of these sessions, I like to give everyone a copy of the canvas on 11×17 paper, so there’s plenty of room to write. I start by setting a timer for 4 minutes and inviting everyone to spend a little quiet writing time, mostly focused on the first box on the upper left of the canvas (the “What’s the problem?” box).
Then we use the questions on the canvas to guide the discussion (usually 60-90 minutes) and explore different facets of the problem.
In the last 10-15 minutes, we focus on the big box at the bottom (“No, really, what’s the actual problem?”) to document the team’s shared understanding of the problem. The transformation from our initial problem statement to the final problem statement is usually quite striking.
Get your copy of the Problem Framing Canvas (and instructions on how to use it) on the Problem Framing page.